Cool Merci für die Antwort. Ich habe den Check gemacht.
Das Problem scheint der WDf01000.sys Treiber zu sein. Hast Du eine Ahnung wie ich das lösen kann? BESTEN DANK
CONCLUSION
_________________________________________________________________________________________________________
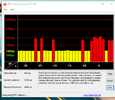
Your system appears to be having trouble handling real-time audio and other tasks. You are likely to experience buffer underruns appearing as drop outs, clicks or pops. One or more DPC routines that belong to a driver running in your system appear to be executing for too long. One problem may be related to power management, disable CPU throttling settings in Control Panel and BIOS setup. Check for BIOS updates.
LatencyMon has been analyzing your system for 0:04:25 (h:mm:ss) on all processors.
_________________________________________________________________________________________________________
SYSTEM INFORMATION
_________________________________________________________________________________________________________
Computer name: DESKTOP-E1TV17F
OS version: Windows 10 , 10.0, build: 19043 (x64)
Hardware: HP ProDesk 400 G6 MT, HP, 8599
CPU: GenuineIntel Intel(R) Core(TM) i7-9700 CPU @ 3.00GHz
Logical processors: 8
Processor groups: 1
RAM: 32606 MB total
_________________________________________________________________________________________________________
CPU SPEED
_________________________________________________________________________________________________________
Reported CPU speed: 30 MHz
Note: reported execution times may be calculated based on a fixed reported CPU speed. Disable variable speed settings like Intel Speed Step and AMD Cool N Quiet in the BIOS setup for more accurate results.
WARNING: the CPU speed that was measured is only a fraction of the CPU speed reported. Your CPUs may be throttled back due to variable speed settings and thermal issues. It is suggested that you run a utility which reports your actual CPU frequency and temperature.
_________________________________________________________________________________________________________
MEASURED INTERRUPT TO USER PROCESS LATENCIES
_________________________________________________________________________________________________________
The interrupt to process latency reflects the measured interval that a usermode process needed to respond to a hardware request from the moment the interrupt service routine started execution. This includes the scheduling and execution of a DPC routine, the signaling of an event and the waking up of a usermode thread from an idle wait state in response to that event.
Highest measured interrupt to process latency (µs): 446.30
Average measured interrupt to process latency (µs): 6.087717
Highest measured interrupt to DPC latency (µs): 420.30
Average measured interrupt to DPC latency (µs): 1.890947
_________________________________________________________________________________________________________
REPORTED ISRs
_________________________________________________________________________________________________________
Interrupt service routines are routines installed by the OS and device drivers that execute in response to a hardware interrupt signal.
Highest ISR routine execution time (µs): 101.2230
Driver with highest ISR routine execution time: Wdf01000.sys - Kernelmodustreiber-Frameworklaufzeit, Microsoft Corporation
Highest reported total ISR routine time (%): 0.005486
Driver with highest ISR total time: Wdf01000.sys - Kernelmodustreiber-Frameworklaufzeit, Microsoft Corporation
Total time spent in ISRs (%) 0.005486
ISR count (execution time <250 µs): 298221
ISR count (execution time 250-500 µs): 0
ISR count (execution time 500-999 µs): 0
ISR count (execution time 1000-1999 µs): 0
ISR count (execution time 2000-3999 µs): 0
ISR count (execution time >=4000 µs): 0
_________________________________________________________________________________________________________
REPORTED DPCs
_________________________________________________________________________________________________________
DPC routines are part of the interrupt servicing dispatch mechanism and disable the possibility for a process to utilize the CPU while it is interrupted until the DPC has finished execution.
Highest DPC routine execution time (µs): 3598.5620
Driver with highest DPC routine execution time: Wdf01000.sys - Kernelmodustreiber-Frameworklaufzeit, Microsoft Corporation
Highest reported total DPC routine time (%): 0.283596
Driver with highest DPC total execution time: Wdf01000.sys - Kernelmodustreiber-Frameworklaufzeit, Microsoft Corporation
Total time spent in DPCs (%) 0.314113
DPC count (execution time <250 µs): 812064
DPC count (execution time 250-500 µs): 0
DPC count (execution time 500-999 µs): 10
DPC count (execution time 1000-1999 µs): 0
DPC count (execution time 2000-3999 µs): 3
DPC count (execution time >=4000 µs): 0
_________________________________________________________________________________________________________
REPORTED HARD PAGEFAULTS
_________________________________________________________________________________________________________
Hard pagefaults are events that get triggered by making use of virtual memory that is not resident in RAM but backed by a memory mapped file on disk. The process of resolving the hard pagefault requires reading in the memory from disk while the process is interrupted and blocked from execution.
NOTE: some processes were hit by hard pagefaults. If these were programs producing audio, they are likely to interrupt the audio stream resulting in dropouts, clicks and pops. Check the Processes tab to see which programs were hit.
Process with highest pagefault count: tiworker.exe
Total number of hard pagefaults 2479
Hard pagefault count of hardest hit process: 408
Number of processes hit: 26
_________________________________________________________________________________________________________
PER CPU DATA
_________________________________________________________________________________________________________
CPU 0 Interrupt cycle time (s): 17.381445
CPU 0 ISR highest execution time (µs): 101.2230
CPU 0 ISR total execution time (s): 0.116327
CPU 0 ISR count: 298049
CPU 0 DPC highest execution time (µs): 3598.5620
CPU 0 DPC total execution time (s): 6.525940
CPU 0 DPC count: 770889
_________________________________________________________________________________________________________
CPU 1 Interrupt cycle time (s): 7.008074
CPU 1 ISR highest execution time (µs): 2.057667
CPU 1 ISR total execution time (s): 0.000107
CPU 1 ISR count: 172
CPU 1 DPC highest execution time (µs): 382.545667
CPU 1 DPC total execution time (s): 0.076647
CPU 1 DPC count: 20365
_________________________________________________________________________________________________________
CPU 2 Interrupt cycle time (s): 7.812157
CPU 2 ISR highest execution time (µs): 0.0
CPU 2 ISR total execution time (s): 0.0
CPU 2 ISR count: 0
CPU 2 DPC highest execution time (µs): 170.929333
CPU 2 DPC total execution time (s): 0.014755
CPU 2 DPC count: 4627
_________________________________________________________________________________________________________
CPU 3 Interrupt cycle time (s): 9.689655
CPU 3 ISR highest execution time (µs): 0.0
CPU 3 ISR total execution time (s): 0.0
CPU 3 ISR count: 0
CPU 3 DPC highest execution time (µs): 88.7010
CPU 3 DPC total execution time (s): 0.007641
CPU 3 DPC count: 3004
_________________________________________________________________________________________________________
CPU 4 Interrupt cycle time (s): 6.134038
CPU 4 ISR highest execution time (µs): 0.0
CPU 4 ISR total execution time (s): 0.0
CPU 4 ISR count: 0
CPU 4 DPC highest execution time (µs): 170.810333
CPU 4 DPC total execution time (s): 0.011116
CPU 4 DPC count: 3896
_________________________________________________________________________________________________________
CPU 5 Interrupt cycle time (s): 6.126682
CPU 5 ISR highest execution time (µs): 0.0
CPU 5 ISR total execution time (s): 0.0
CPU 5 ISR count: 0
CPU 5 DPC highest execution time (µs): 171.469333
CPU 5 DPC total execution time (s): 0.009631
CPU 5 DPC count: 3334
_________________________________________________________________________________________________________
CPU 6 Interrupt cycle time (s): 6.280662
CPU 6 ISR highest execution time (µs): 0.0
CPU 6 ISR total execution time (s): 0.0
CPU 6 ISR count: 0
CPU 6 DPC highest execution time (µs): 112.770667
CPU 6 DPC total execution time (s): 0.008102
CPU 6 DPC count: 2521
_________________________________________________________________________________________________________
CPU 7 Interrupt cycle time (s): 6.731413
CPU 7 ISR highest execution time (µs): 0.0
CPU 7 ISR total execution time (s): 0.0
CPU 7 ISR count: 0
CPU 7 DPC highest execution time (µs): 142.454333
CPU 7 DPC total execution time (s): 0.012427
CPU 7 DPC count: 3441
_________________________________________________________________________________________________________


")